Andrews Fork is one of the most popular technical analysis tools using charts. Investors and traders who intend to start technical analysis professionally should be familiar with the Andrews fork, how to use it and its applications in analysis. Using this simple tool, you can determine the current and future status of a digital stock or currency by identifying channels and key points in the chart. To find out what Andrews fork is, we suggest you stay with at the end of this article.
Definition of Andrews fork, use of channels in technical analysis
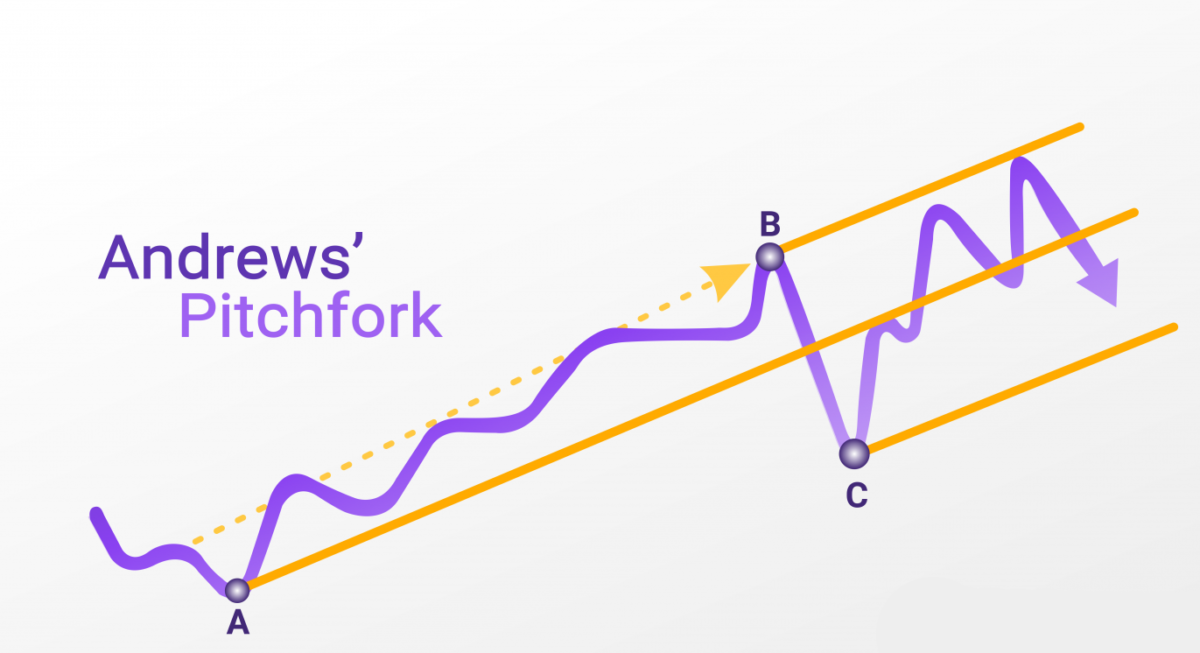
Andrew’s Pitchfork is one of the best ways to find profitable opportunities and take advantage of financial market fluctuations. This tool was first used by Allen H. Andrews, which is why the name Andrews Fork was chosen for it. The structure of the fork is very simple and consists of two parallel lines with a middle line located in the middle of these two parallel lines. The distance between adjacent lines is equal in pairs and generally form three channels.
Alan H. Andrews believed that classical trend lines could not provide complete information about the status of a stock. So he considered lines that go through more points and have more contact with the price. The two side lines of the Andrews fork create a main channel in which price fluctuations and reactions take place, making it easier to check the price. Using the Andrews fork, in addition to checking the current price of digital currency, one can get a lot of information about the price movement, its sensitive points and its future.
How to draw Andrews fork, how to use Andrews fork?
To draw Andrews’ fork, we must follow three important steps. Drawing an accurate and practical Andrews fork requires experience, practice and repetition. However, if you are familiar with the basics of drawing Andrews fork, you can gradually gain enough skills. The important point is that in order to increase the validity of the drawn fork, you must increase the number and amount of collisions to its surfaces. For example, when looking at the price chart of theon , you should be careful that the Andrews fork channel is in the range where the price returns when it hits the fork surfaces. In the following, we will examine the three steps of drawing Andrews fork?
The first step is to find the trend and select the first three points
To draw the Andrews fork, you must first identify the trend in the price of a stock or digital currency. The trend can be ascending or descending. Then you need to identify three important points in the process. These three points include two price floor points and one ceiling point in the uptrend and one floor and two ceilings in the uptrend. The selection of points must also be done one by one. For example, in the uptrend, the first point is a floor. Then you have to choose a roof and finally find the second floor. These points are named with the numbers 1, 2 and 3 or the letters A, B and C, respectively.
The second step is to draw the middle line in Andrews’ fork
After finding points 1, 2 and 3, it is time to find the location of the midline. To do this, a straight line is drawn between points 2 and 3, and then the midpoint between these two lines is marked. Now you need to draw a straight line from point 1 that passes through the midpoint you set between 2 and 3. This line is actually the middle line of Andrews’ fork.
The third step is to draw the side lines of the Andrews fork
Now that the middle line is drawn, it is time to complete the fork using the side lines. To do this, it is enough to draw a parallel line from points 2 and 3 and a distance from the midline. After this, a shape like a fork is formed. At this point you should check the validity of your fork. To check the validity of Andrews fork, it is enough to specify the price return points. Prices at the lowest point should hit the bottom sideline and return, and at the highest point should happen at the top line. The higher the number of these price points, the greater the credit of the Andrews drawn fork. There are also a number of points in the midline that you should pay attention to. You can practice this fork right now on the Bitcoin to price chart.
Drawing Andrews fork with the help of various tools
We tried to teach the basics of using the Andrews fork tool to get acquainted with the main concepts of drawing it. But you do not really need to do this manually. Almost all reputable online exchanges, including Exchange, offer ready-made tools for analysis. You can easily make your own fork with the help of Andrews fork drawing tool in exchange offices or technical analysis sites such as Trading View. But keep in mind that using these tools is also very important to find the starting points and you must follow the same basic principles of drawing the Andrews fork.
Authentic Andrews fork features
To determine the validity of your drawn fork, you should check the following features:
- Its midline has the highest number of price reactions in the past.
- Point 3 in terms of price must be between the first and second points. Otherwise, the graphic form has been a trend regression channel.
- The slope of the fork should not be more than 60 degrees. Using the Trend Angle tool on the Trading Wave platform and similar tools to measure the angle of the trend, you will be able to verify the fork angle (midline angle). To draw this angle, the price chart must be one-to-one. You can use the “auto” option to unify in trading.
- Include all price data between the start and end intervals. In other words, we do not have out-of-range data.
At first glance, you may not see all of these features in your grip. So never stop practicing and repeating Andrews fork drawing. The more exercises and repetitions you have, the better your Andrews fork drawing will be.
Principles of trading with Andrews fork
So far we are familiar with the drawing of the Andrews fork, now it’s time to get acquainted with the principles of the Andrews fork. You can use these principles and rules in your trading strategies. Various traders have discovered many principles or rules for Andrews fork based on their experience. However, the most important principles that work in most cases include the following:
- Most of the time (80% of the time) the price moves towards the midline of the fork and touches it. (The most important principle)
- The price often changes direction or pivot after reaching and touching the midline.
- Sometimes the price tends to touch the midline several times and fluctuate near it.
- When the price fails to touch the midline (20% of the time) and changes direction before reaching the midline, there will be a possibility of rapid and powerful price movement up to point 3.
- When the price breaks the middle line, it will most likely return to this line (Pullback) before continuing on.
Note that these principles are not permanent and there is a possibility of error in them, so you must be careful to make decisions based on them. Also, the greater the validity of the drawn fork, the lower the probability of error in these principles. Examine the prices of different digital currencies, including the price of bitcoin cache , and try to draw multiple forks in different parts of the chart. Using the Andrews fork will also improve your ability to identify price trends.
Become a professional trader with the help of Andrews fork
In digital currency markets, familiarity with technical analysis tools, especially the Andrews fork, is very important. With practice and repetition, you can gain more skill in drawing the Andrews fork.